

Debugging Matlab Code with Mayhem

Matlab, a powerful tool for scientific and engineering applications, offers a wide range of built-in functions and toolboxes that enable researchers and developers to create complex algorithms and solutions.
Matlab Coder generates readable and portable C and C++ code, which you can integrate into your projects as source code, static libraries, or dynamic libraries. However, as code complexity increases, so does the likelihood of bugs and errors.
Ensuring the reliability and security of Matlab functions is crucial, especially when deploying them on resource-constrained devices like microcontrollers or FPGAs. This is where Matlab debugging and solutions like Mayhem come into play.
Matlab Code Generation
Matlab's code generation process involves converting Matlab code into executable code in languages like C or C++, which can then run on various platforms or embedded systems. This capability allows Matlab algorithms to be deployed in real-time processing scenarios, extending their reach to devices with limited resources. However, this transition from Matlab to executable code introduces the potential for errors and bugs that might not have been evident during routine testing.
Integrating Matlab With Mayhem
To ensure the reliability and security of Matlab functions during code generation, a combination of techniques can be employed. In this blog post, we’ll go through an example integrating and testing Matlab code using Mayhem.
Mayhem’s approach combining symbolic execution and fuzzing testing techniques is particularly effective when testing Matlab code. Symbolic execution involves exploring all possible inputs to a function, which helps identify potential vulnerabilities and edge cases in the code. Fuzzing, on the other hand, entails subjecting the Matlab function to a wide variety of input data, often crafted with heuristics. This approach can reveal unexpected bugs or errors that might not be evident during normal testing.
Debugging MatLab: A Step by Step Tutorial Using Mayhem
Let's delve into an example that demonstrates the importance of thorough testing during code generation. Imagine a Matlab function with a hidden bug that only manifests when certain characters are input.
In this example, when the characters 'B U G' are provided as input, a bug is triggered. In Matlab, this bug is a simple error without any sort of memory leakage, but during code generation, it will actually cause an out-of-bounds write.
This particular bug is a prime candidate for debugging and testing using Mayhem. Inside of the ForAllSecure organization on GitHub, we'll refer to an example repository named "mayhem-matlab" to show you how it’s done.
Inside this repository's function folder, several key files play a role:
- Dockerfile: This file contains instructions for building our images, which containerize our application when we upload it to Mayhem.
- Mayhemfile.yml: This is the configuration file for our test settings.
- mayhemit.m: This is the MatLab function we’re testing
- run_mcodesh: This file contains the full set of instructions, from start to finish, to test our application using Mayhem.
Inside the ‘run_mcodesh’ Script
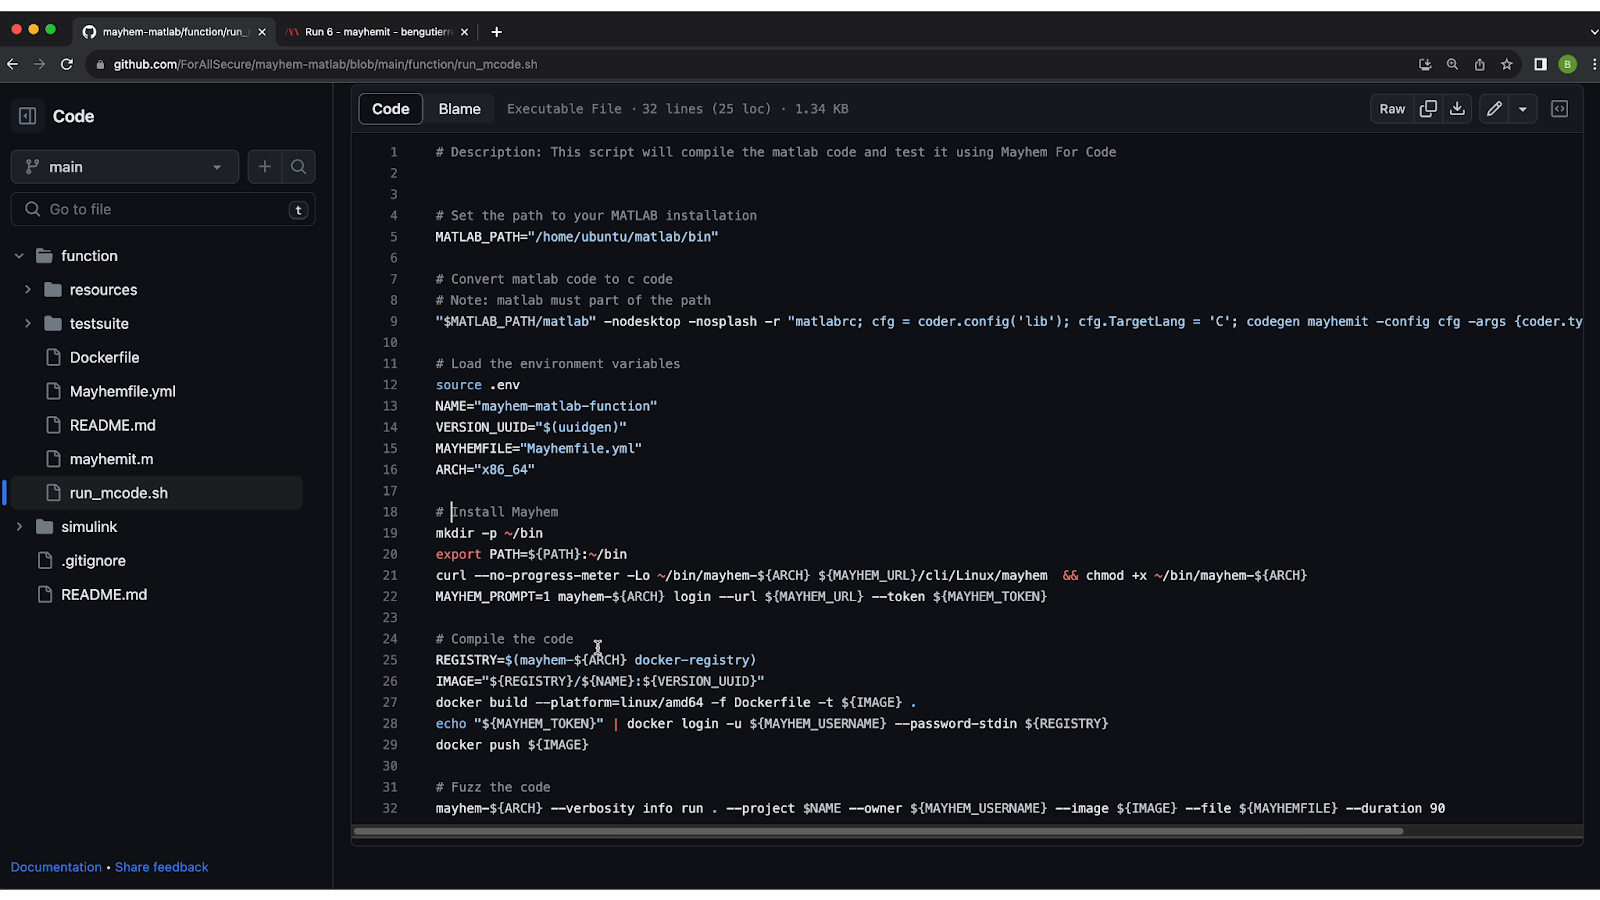
Inside the ‘run_mcodesh’ script, you’ll see the full set of instructions to test your Matlab code with Mayhem, the main steps being:
- Use Matlab coder to convert Matlab code to C code. This can also be done in the Matlab GUI.
- Install Mayhem.
- Compile the C code and upload it to the Mayhem registry.
- Test the code using Mayhem.
Inside the 'Mayhemfile.yml' Configuration File
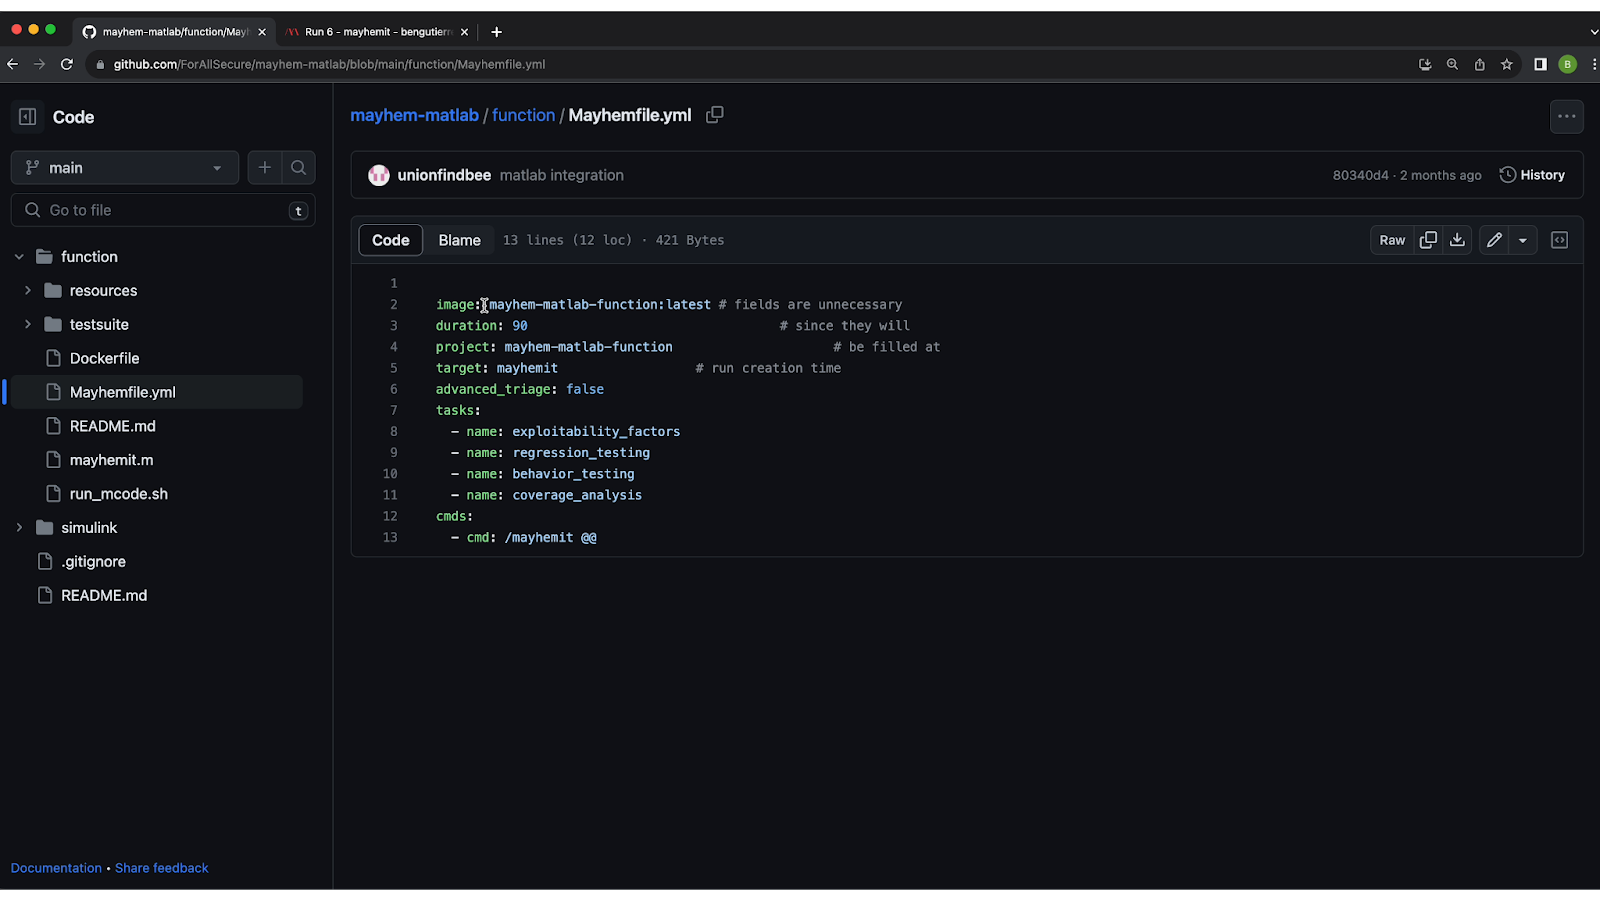
Inside the 'Mayhemfile.yml' configuration file is where you specify the configuration settings for your tests. These settings define how Mayhem will analyze and test your code.
Here’s how to set up each configuration:
- Image Name: Identify the image you want to test using Mayhem. In this example, we’re testing ‘mayhem-matlab-function: latest’.
- Test Duration: Specify the duration of the test. In this example, we’re testing the code for 90 seconds.
- Project Name: Assign a name to your project. In this example, it's "mayhem-matlab-function."
- Target Name: Define the specific target for testing, which is the name of your Matlab function ('mayhemit', in this case).
There are also a few tasks listed in the file that will happen during the test:
- Exploitability Factors: Mayhem examines your code for potential exploitability factors. These factors can be adjusted to to harden your binary hardening, helping to safeguard your code against attacks.
- Regression Testing: Every time Mayhem finds an exploit, it will save it to the regression test bank, ensuring that fixes stay fixed.
- Behavior Testing: Mayhem tracks and analyzes the behaviors exhibited by your code during testing. It records the total number of behaviors observed, giving you insights into how your code responds to different inputs.
- Coverage Analysis: Ensure comprehensive testing by evaluating code coverage. Mayhem provides a coverage analysis that indicates the percentage of your codebase that was exercised during testing. This helps you determine whether your application has been thoroughly tested.
At the bottom of the script, you’ll see the command ‘/mayhemit @@’, which executes your application test using Mayhem.
Inside the Docker file
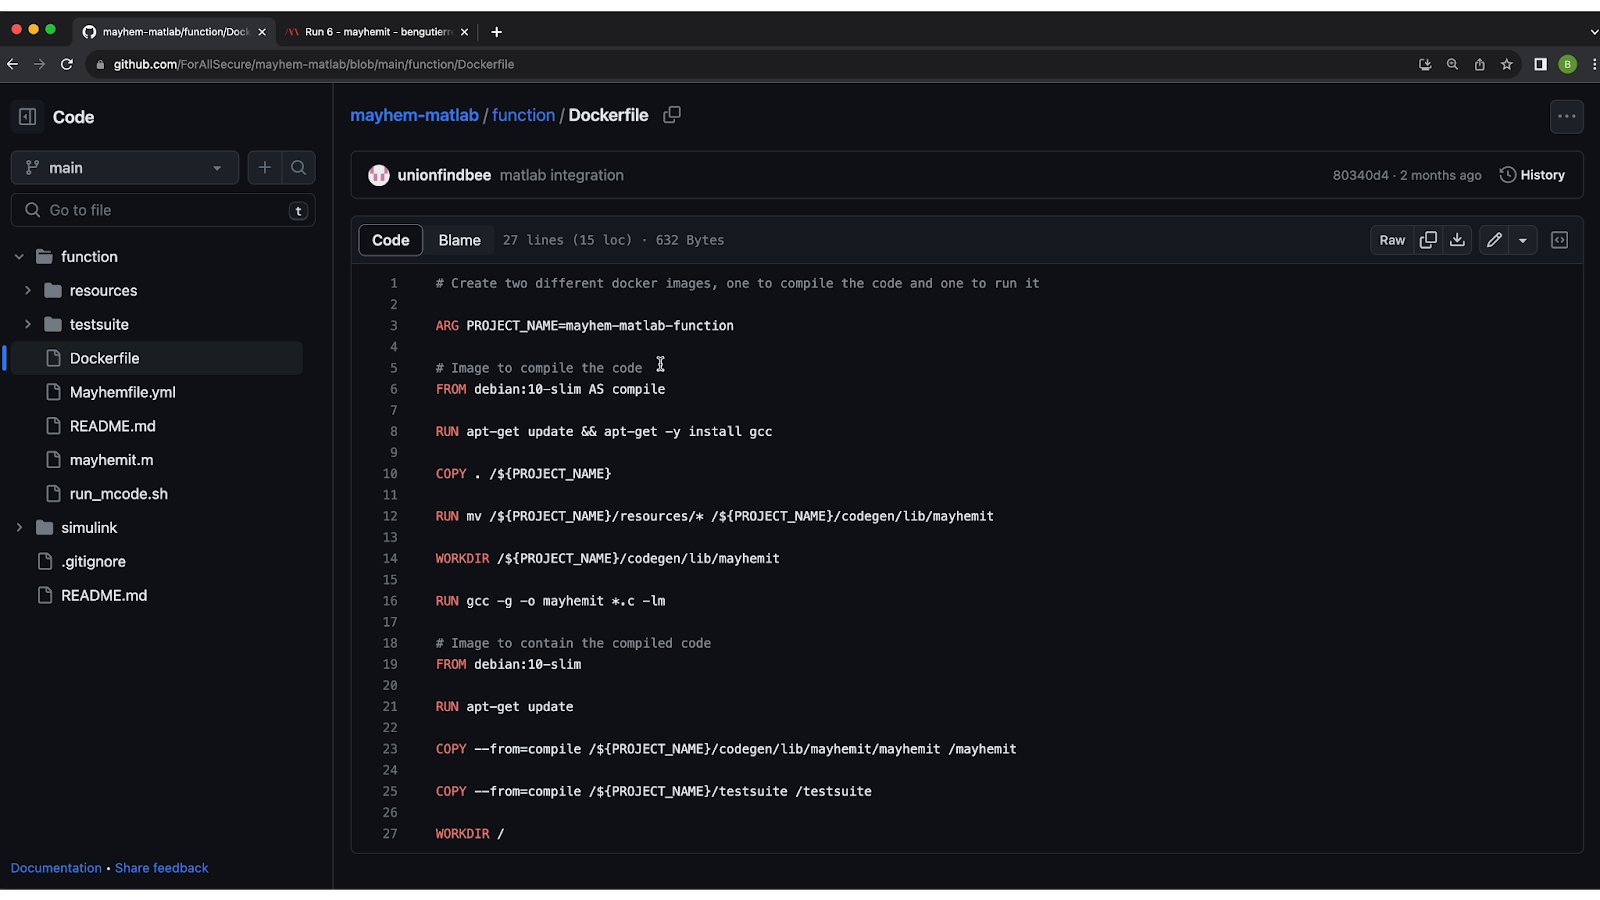
Inside the Docker file, there are two points of interest:
- The image to compile the code. This is a set of instructions that compiles the C code generated by Matlab.
- The image to contain the compiled code. This is the image with the compiled application under a base image. In this example, we’re using ‘debian:10-slim’ as the base.
Running the Script
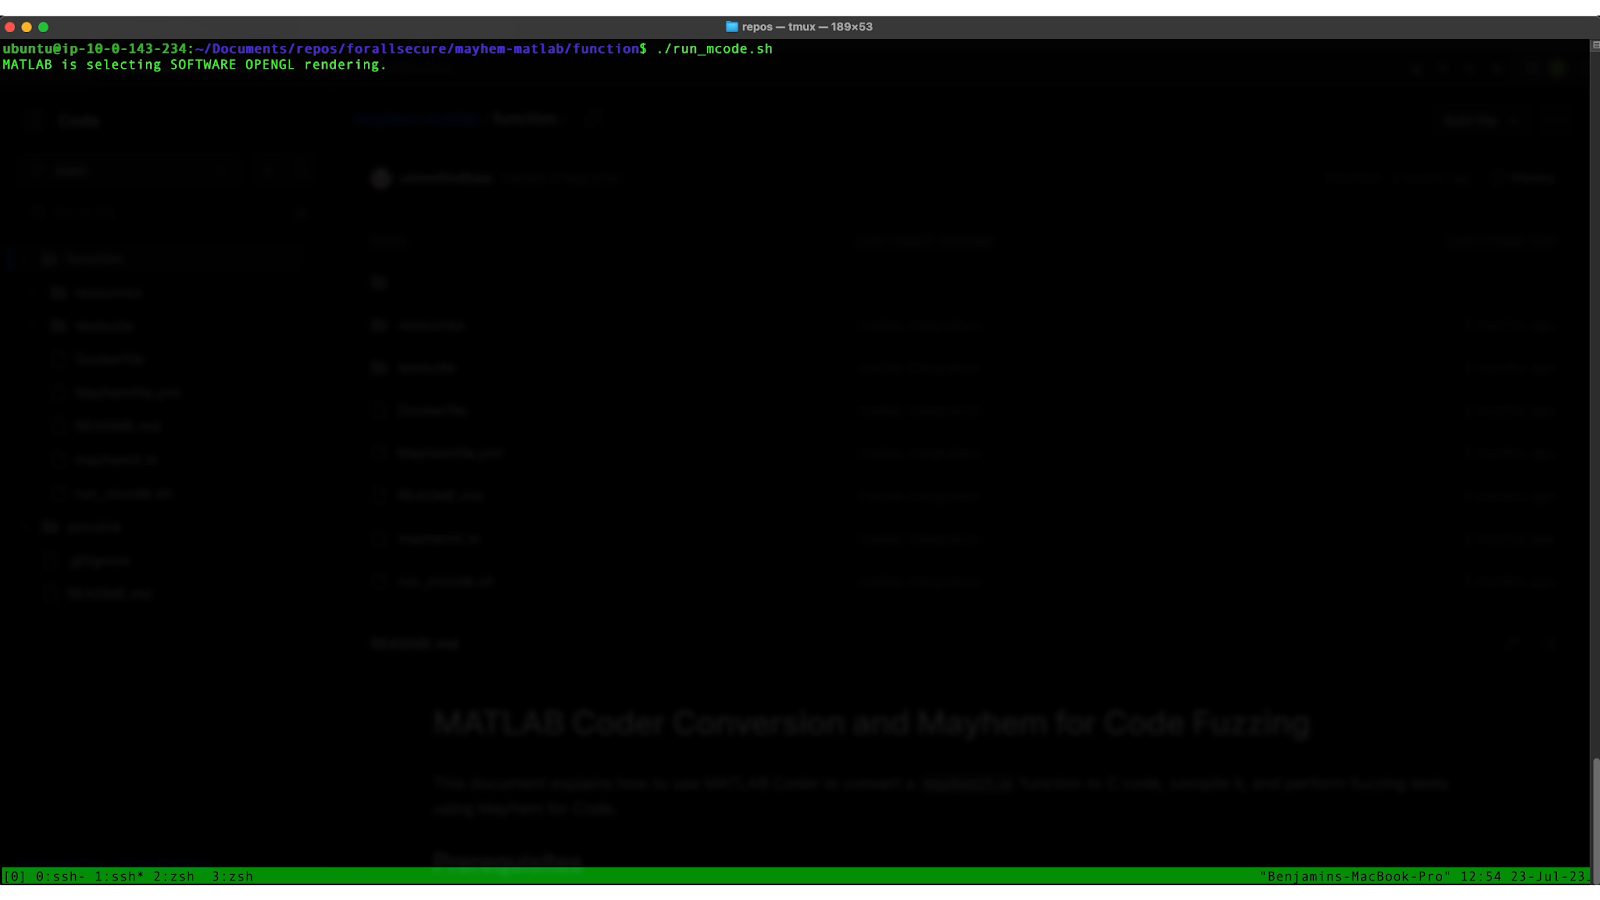
Now it’s time to open a terminal window and run the script. Simply copy the script and paste it into your terminal to initiate the testing process using Mayhem.
Navigating to the Results of Your Run
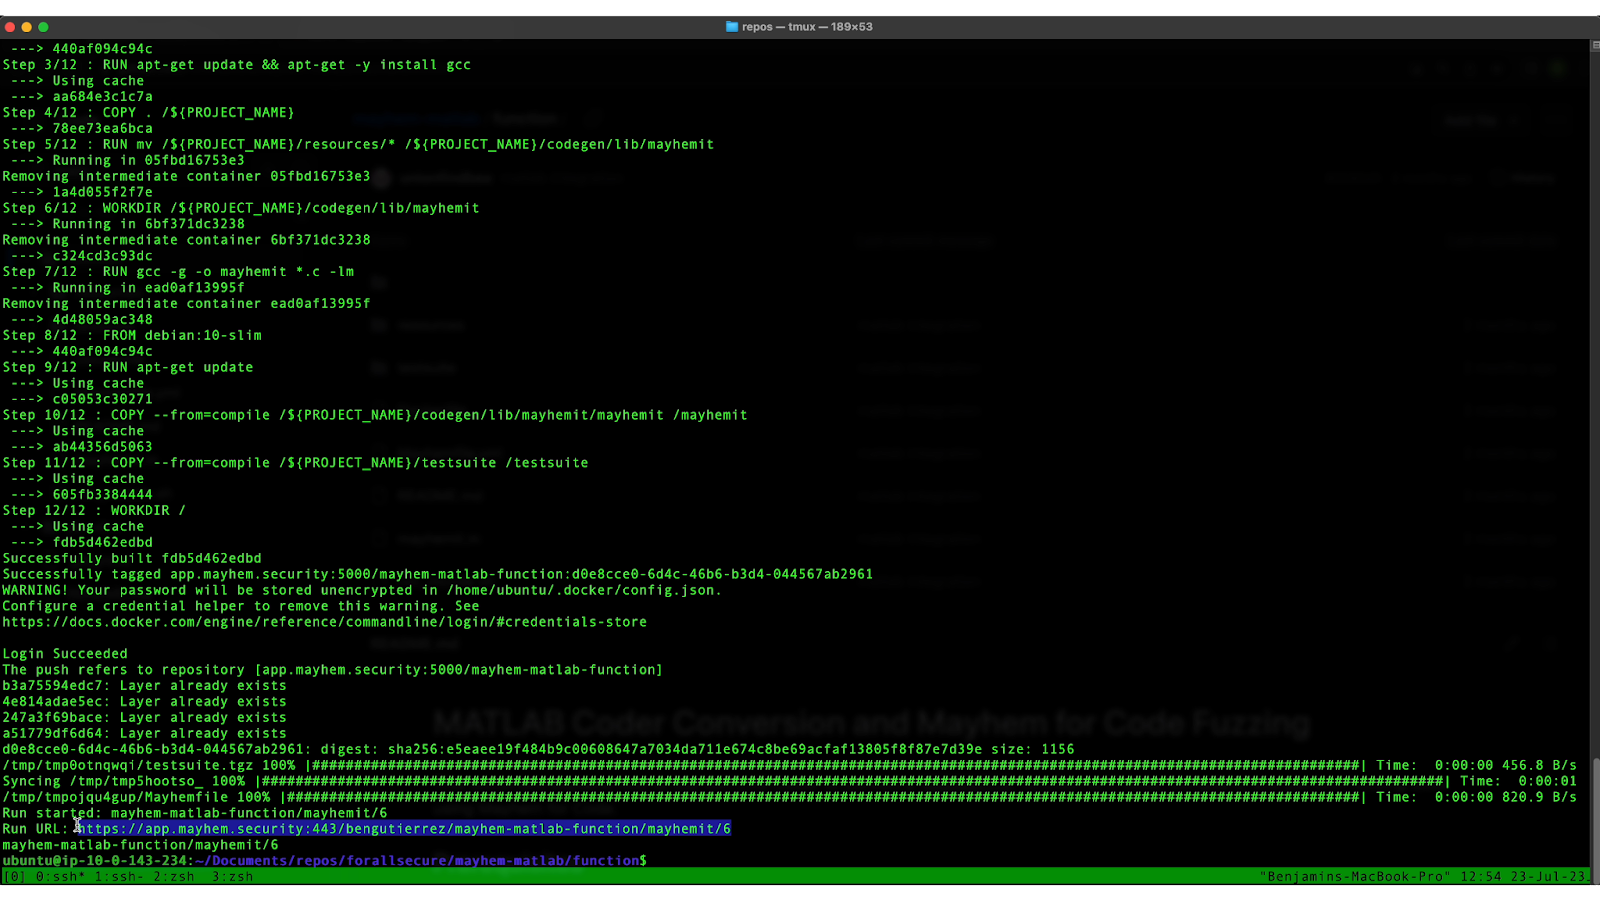
To navigate to the results of the run, copy and paste the url shown at the bottom where it says “Run URL” or log into your Mayhem account and navigate to the current project run.
Analyzing Mayhem’s Results: The Dashboard
After your run is complete, Mayhem will provide you with valuable insights into your Matlab application's behavior, vulnerabilities, and bugs. Mayhem's detailed report provides information on exploitability factors, defects, behaviors observed, code coverage metrics, and more.
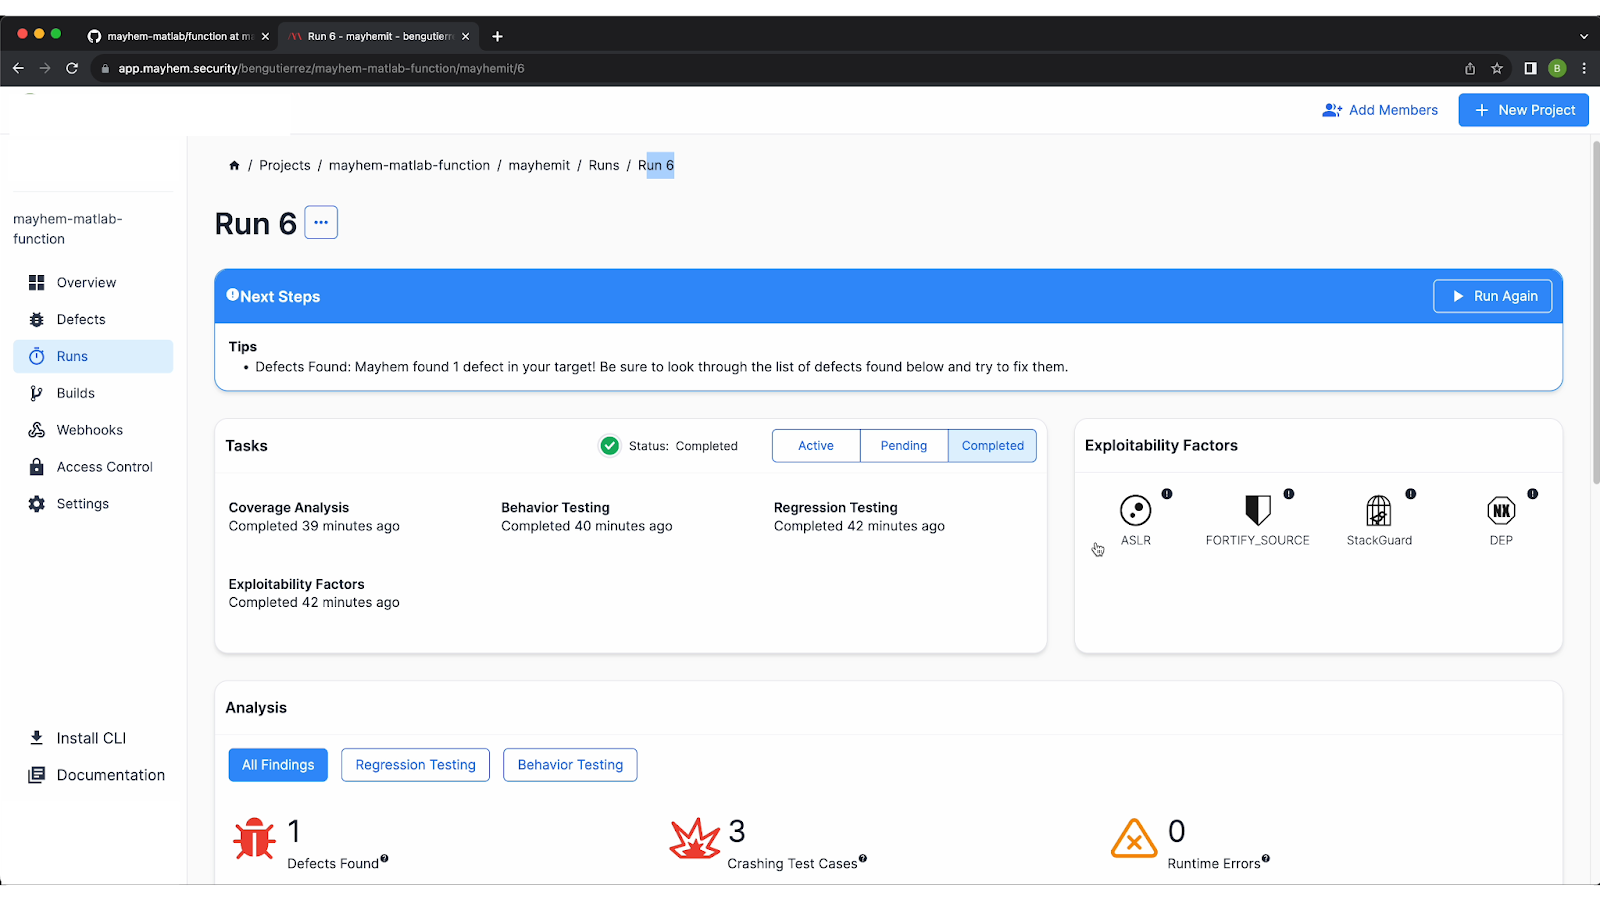
Exploitability Factors
In this example, the first thing you can see in the top right of your screen is the exploitability factors. These weren’t enabled in the example for the Matlab binary, but they can be enabled for future test runs in order to harden your binary.
Analysis Dashboard
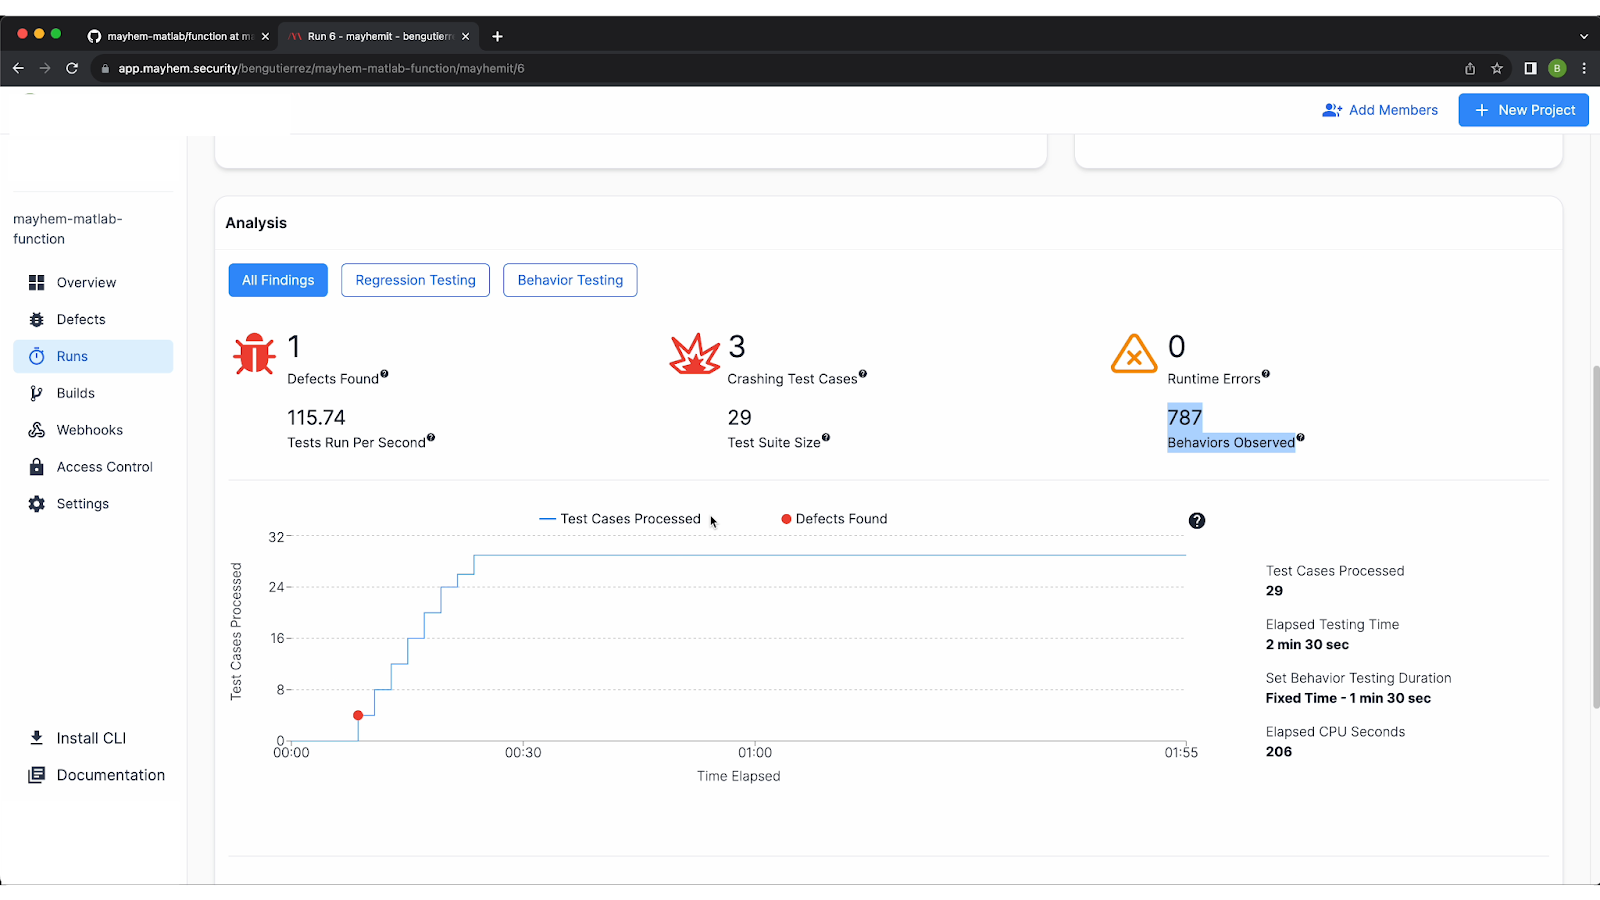
The next thing you’ll see under the Analysis section of the dashboard is that a defect was found during the test run. The analysis gives you all the top-level metrics of the run, including the number of test cases generated that caused crashes (in this case, 3), the test suite size (29), and the total number of behaviors observed (787).
Looking at the graph provided, you can also see when any defects were found. In this example, you’ll see that the defect was found early on.
Code Coverage
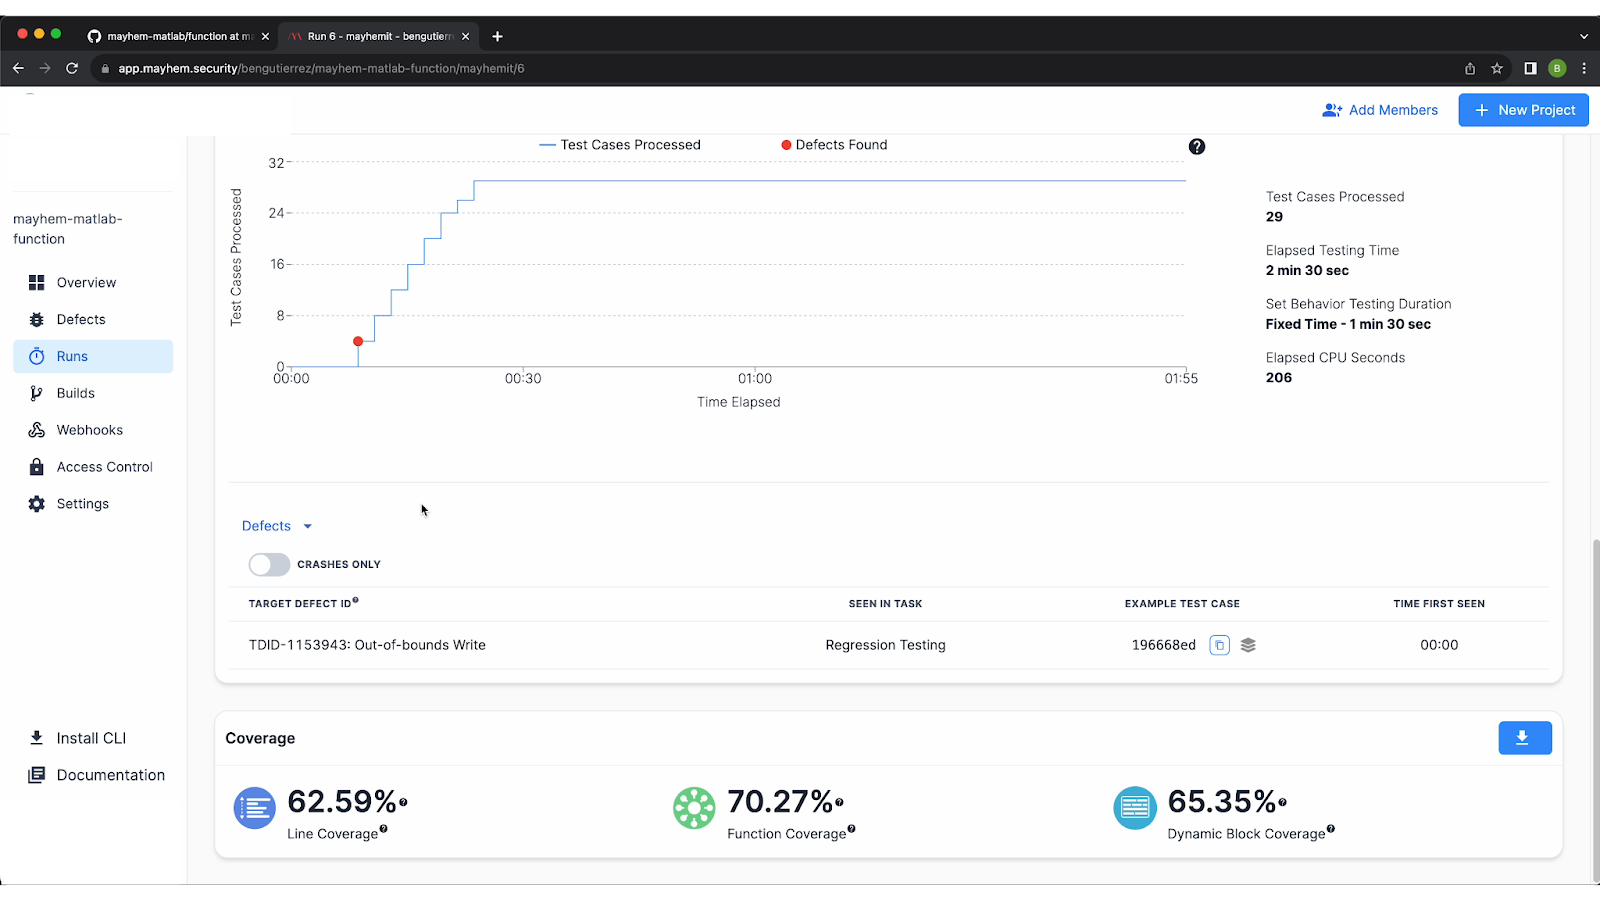
The bottom of the page includes your code coverage metrics:
- Dynamic Block Coverage: The percentage of blocks or memory blocks covered during the run
- Function Coverage: The percentage of functions covered in the run
- Line Coverage: The total number of source lines of code covered during the run
Defects Found in the Matlab Function: The Detailed Report
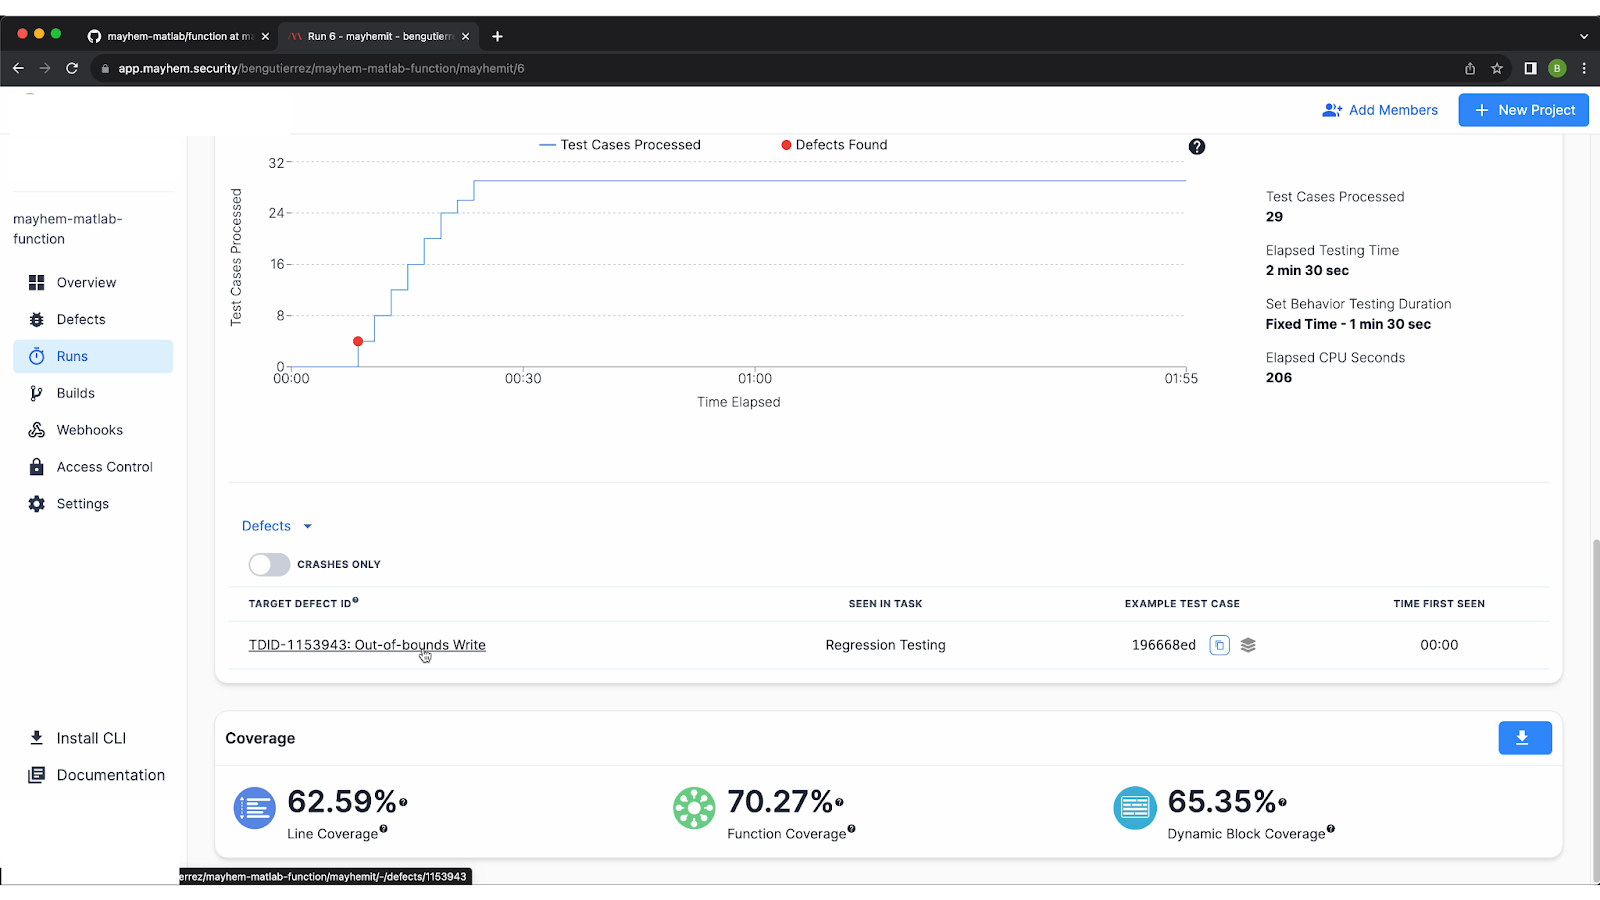
Under the defects section of the dashboard, you’ll find that Mayhem flagged an out-of-bounds write issue triggered by the input 'B U G' to the Matlab function.

By clicking on the defect, you can find a detailed report. In this case, you can see that the test case that caused the crash was ‘bug. . . . .’. The standard output was “bug here!”, which was something we put in our example function.
We also provide a backtrace, and inside of the backtrace you'll see the actual source files as well as lines of code. This can help you to better visualize what actually occurred during the run, and can also be integrated with Backtrace and Sentry.
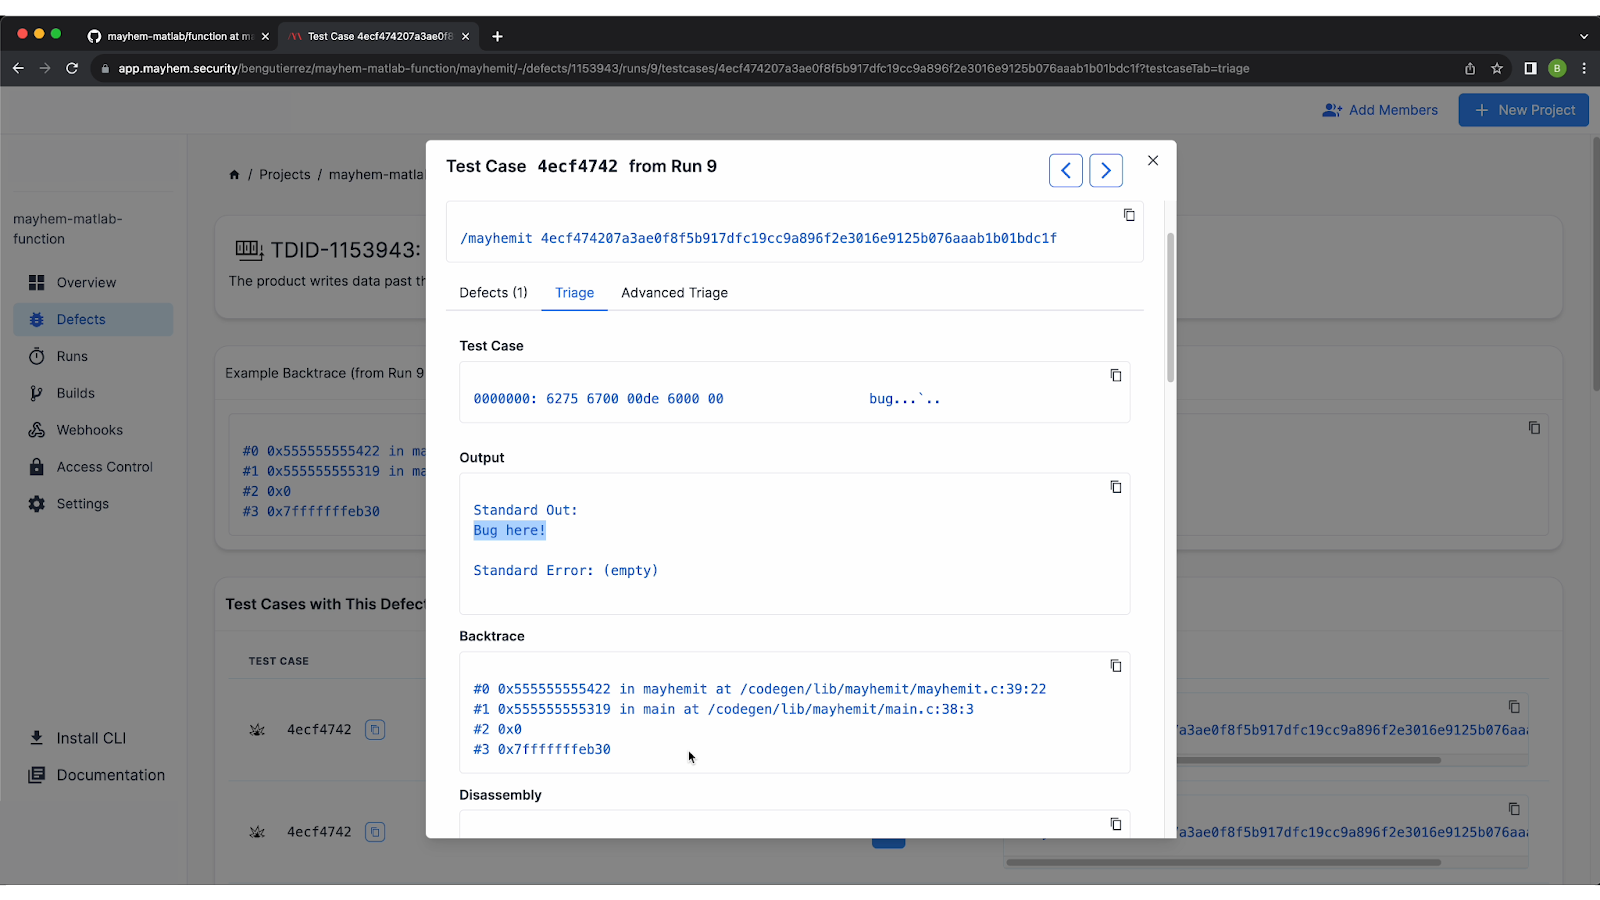
The detailed report also provides information such as disassembly, the faulting address, memory address, register states, the signal number for how the application crashed, memory map, and more. The detailed information is provided so that you can easily reproduce the issue that occurred and debug your application.
Secure Your Matlab Code with Mayhem
Especially for code that will be run on hardware, it is extremely important to ensure that your application is reliable and secure. Debugging Matlab code, especially during code generation, is essential to prevent errors from propagating to the executable code.
By incorporating tools like Mayhem into the Matlab development workflow, developers can confidently deploy their algorithms on resource-constrained devices, knowing they've undergone rigorous testing.
To experience firsthand how Mayhem simplifies the process of ensuring reliable and secure Matlab applications, schedule a personalized demo with our team today.
{{code-cta}}